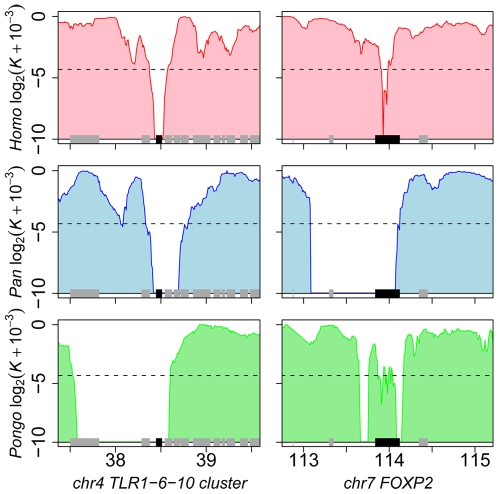
Figure 7. Candidate hotspots of recent positive selection at the Toll-like receptors 1, 6, and 10 cluster and the FOXP2 locus.
Each graph shows the variation of the log2 of K (+0.001 to avoid null values) at two candidate hotspots of recent adaptive evolution in human (average of the two individuals, red), chimpanzee (blue) and orangutan (green). To facilitate comparisons between genomes, values of K for chimpanzee and orangutan were projected on their human orthologous coordinates and gene symbols are those for human in all three species. Other legends are identical to Figure 1.

