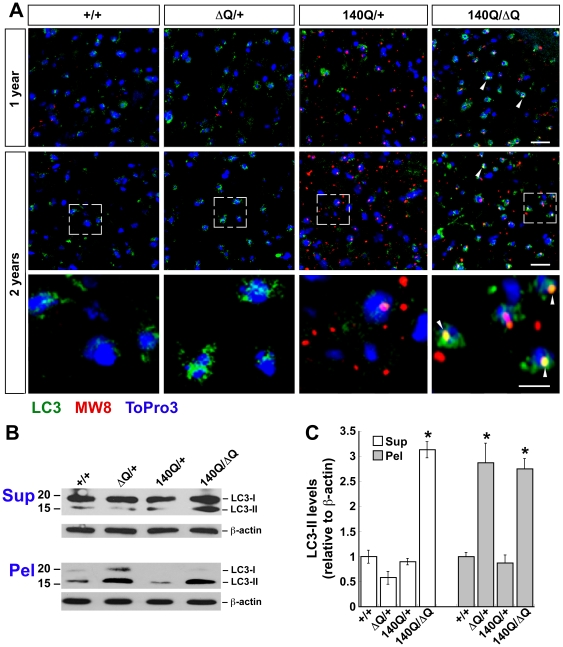
Figure 5. ΔQ-htt expression in mice enhances LC3 immunostaining and LC3-II steady-state levels.
(A) Confocal images of LC3 (green) and htt aggregate (MW8, red) immunostaining in the striatum from 1 year and 2 year old wild-type (+/+), HdhΔQ/+, Hdh140Q/+, and Hdh140Q/ΔQ mice (n = 4 of each genotype). Nuclei were stained with To-Pro-3 (blue). Enlarged images of the areas enclosed by dashed white boxes are shown in the bottom panels. White arrowheads indicate examples of htt aggregates co-immunostaining with LC3 (yellow signal). Scale bars = 25 µm (top panels), 10 µm (bottom panels). (B) Western analyses for LC3-I and LC3-II in striatal supernatant (Sup) and pellet (Pel) factions from 2 year old wild-type (+/+), HdhΔQ/+, Hdh140Q/+, and Hdh140Q/ΔQ mice (n = 4 of each genotype). Blots were stripped and re-probed with an antibody against β-actin to control for protein loading. The positions of protein standards (in kD) are indicated on the left. (C) Quantification of LC3-II levels in the supernatant and pellet fractions relative to actin. *P<0.004 versus +/+.

