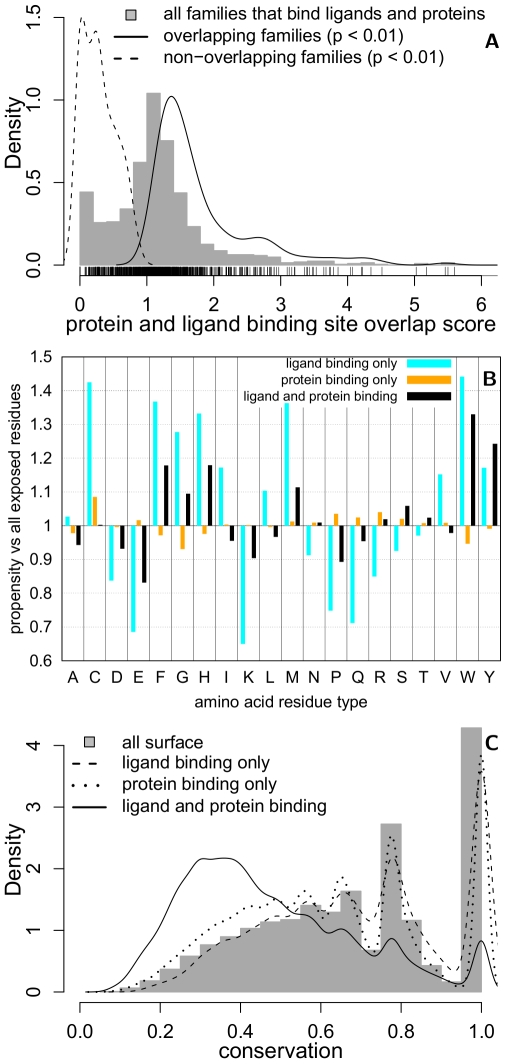
Figure 1. The overlap of ligand and protein binding sites within protein families.
(A) The distribution of overlap scores (Eqn 1) is shown for all families that bind both ligands and proteins (grey; n = 1,028), and the subsets of families with a statistically significant overlap (p 0.01; solid; n = 197) or non-overlap (p
 0.01; dashed; n = 113). The highest overlap score observed is 10.83 (not shown). (B) The residue type propensity (Eqn 3) and (C) conservation (Eqn 4) at alignment positions that bind both ligands and proteins (black; n = 102,436), bind ligands (cyan; n = 46,610), bind proteins (orange; n = 491,723) in comparison to all solvent-exposed residues (grey; n = 1,147,882). The statistical significance of the residue propensities was estimated by a bootstrap resampling procedure (Table S5).

