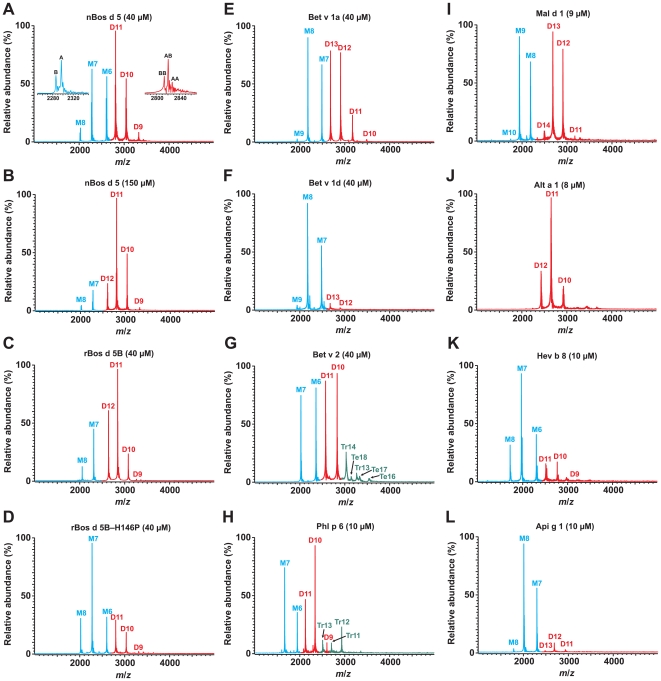
Figure 2. ESI FT-ICR mass spectra of allergens measured in 10 mM NH4OAc (pH 6.9) at varying allergen (monomer) concentrations.
Numbers indicate different protein ion charges and the letters M (and color blue), D (red), Tr (green), and Te (green) refer to the signals from a monomer, dimer, trimer, and tetramer, respectively. Note that some monomer and dimer charge states overlap in the spectra. The left inset in A shows the magnification of monomer charge state 7+, the right inset the dimer charge state 11+.

