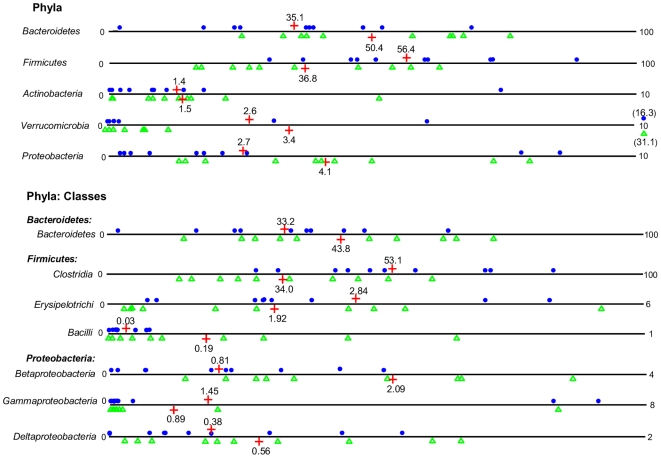
Figure 2. Relative abundances of bacterial phyla and classes.
Relative abundances (%) of bacteria were determined in feces from human adults with type 2 diabetes (green triangles, N = 10) and non-diabetic controls (blue dots, N = 10) by pyrosequencing analysis of the V4 region of the 16S rRNA gene. Mean values are denoted by red crosses and numbers. Values out of scale are shown in brackets.

