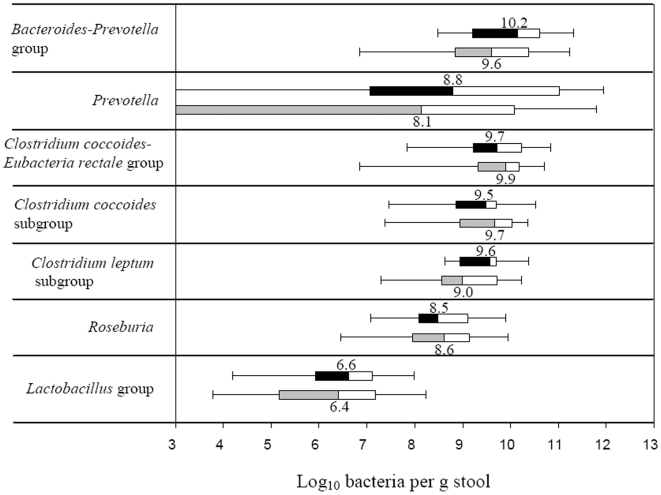
Figure 5. Box-and-whisker plots of bacterial groups quantified by qPCR.
Bacterial groups quantified by SYBR Green qPCR and expressed as Log10 bacteria per g stool in human adults with type 2 diabetes (black and white boxes; N = 18) and non-diabetic controls (grey and white boxes; N = 18). The median counts are presented by numbers. Boxes show the upper (75%) and the lower (25%) percentiles of the data. Whiskers indicate the highest and the smallest values.

