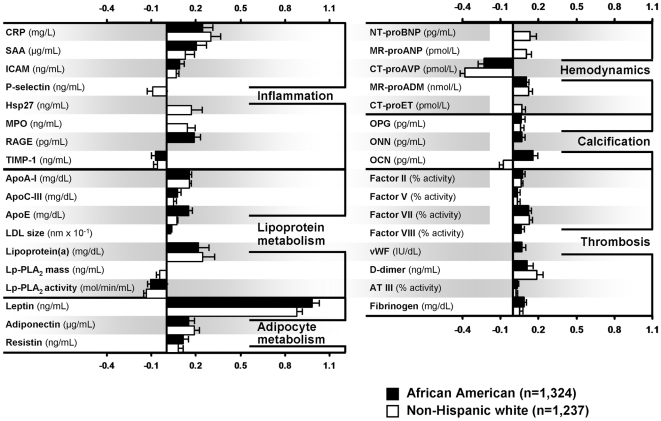
Figure 1. Association of female sex with circulating levels of protein markers.
Multivariable regression analyses; markers independently associated with female sex (graphical representation of Table 4, P<0.05, β±SE for 1 log change in a marker level is shown).

