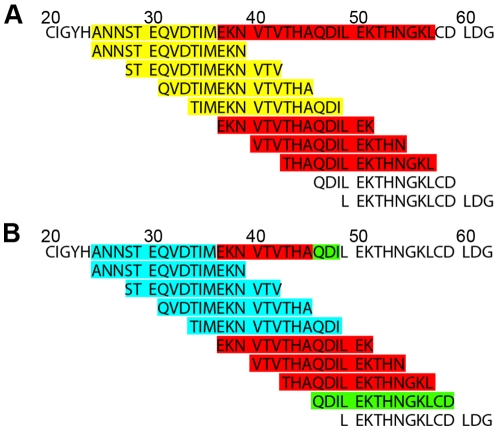
Figure 4. Principle of generation of semi-quantitative antigenic maps.
Integrated intensities from peptide scanning analyses were transferred to the aa sequence as shown here for the HA aa sequence from HPAIV A/tufted duck/Switzerland/V504/06(H5N1) within the sequence range from aa position 20 to 63, as indicated. (A) Semi quantitative display of the gross signal intensities in color-coded categories: 100%–40% (red), 40%–30% (yellow). (B) Semi-quantitative display of the net signal intensities in color code categories: 100%–70% (red), 70%–40% (green) and 40%–20% (light blue).

