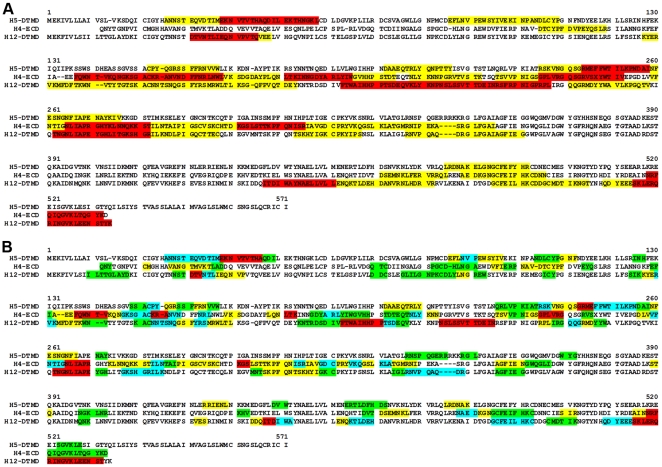
Figure 5. Antigenic maps of AIV HA domains reacting with their homologous sera.
Color code indicates (A) the gross signal intensities found (compare to Fig. 4A, 100%–40% (red) and 40%–30% (yellow)) and (B) the net signal intensities found (compare to Fig. 4B, 100%–70% (red), 70%–40% (yellow) and 40%–20% (light blue)).

