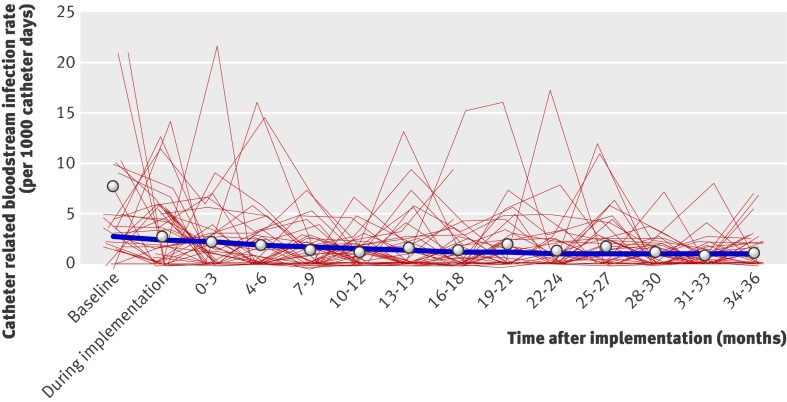
Catheter related bloodstream infection rate as a function of time. Circles represent mean infection rate per quarter; thick blue line represents estimated mean rate of infection modelled as a linear-spline function in which rate of change in mean infection rate is allowed to change after 16-18 month period; thin red lines represent changes in observed infection rates over time within a random sample of 50 intensive care units

An official website of the United States government
Here's how you know
Official websites use .gov
A
.gov website belongs to an official
government organization in the United States.
Secure .gov websites use HTTPS
A lock (
) or https:// means you've safely
connected to the .gov website. Share sensitive
information only on official, secure websites.
