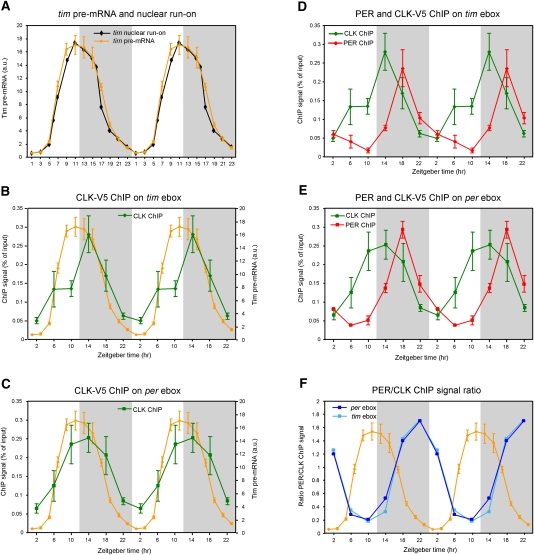
Figure 1.
CLK-V5 and PER rhythmically bind to Per and Tim promoters. (A) Circadian transcription of yw;;dClk-V5 flies. Relative levels of tim pre-mRNA were quantified by qPCR. Each time point represents the average and standard error of two independent experiments. The profile of the nuclear run-on assay (black) of tim published by So and Rosbash (1997) is displayed for comparison with tim pre-mRNA rhythms assayed by qPCR (orange). (B,C) ChIP of CLK-V5 in yw;;dClk-V5 flies. The graphs show qPCR values of CLK-V5 and PER binding to the tim promoter (B; green) and per promoter (C; green). Primers were in regions containing an ebox (see the Materials and Methods for details). Values represent the relative amount of chromatin immunoprecipitated over the input for each time point. The tim transcription curve (in orange) from A is shown for comparison. (D,E) ChIP of PER and CLK in yw;;dClk-V5 flies. The graphs show qPCR values of PER binding to the tim promoter (D; red) and the Per promoter (E; red). Graphs showing CLK binding to tim promoter (D; green) and per promoter (E; green) are identical to the graphs in B and C, respectively. (F) Quantification of the ratio of PER/CLK ChIP signal on tim (light blue) and per (dark blue) promoters. Ratios were calculated from experiments presented in B–D. The tim pre-mRNA profile from A is superimposed to the two ratio profiles.

