Figure 2.
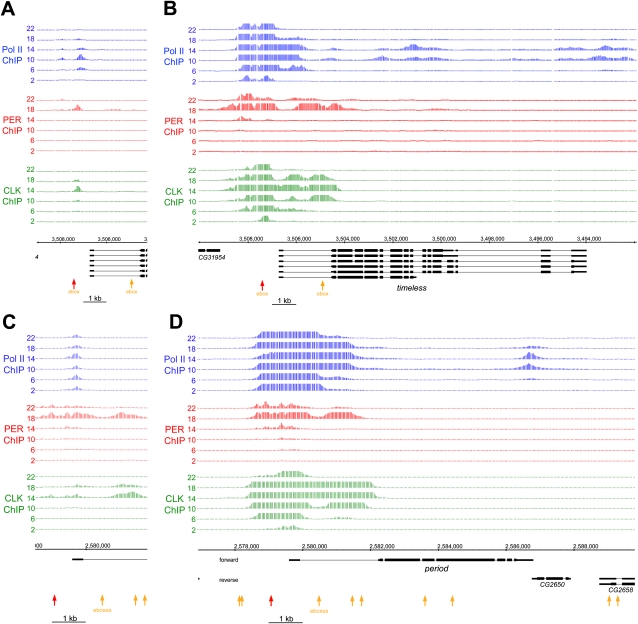
CLK-V5 and PER rhythmic DNA binding occurs in the same promoter region and determines the timing of Pol II elongation. Tiling array data from Pol II (blue), PER (red), and V5 (green) ChIP experiments are displayed for tim (A,B) and per (C,D) genes. Each line illustrates one of the six time points (hours are indicated as ZT), and the data shown are the result of two independent ChIP tiling experiments. Data were analyzed using the model-based analysis of tiling arrays (MAT) algorithm (Johnson et al. 2006) and were converted to a linear scale for easier viewing using the Integrated Genome Browser from Affymetrix. The genomic location and the different isoforms for both genes are displayed in black, and the locations of the perfect consensus ebox (CACGTG) are represented by orange and red arrows (the red arrows indicate the ebox-containing region amplified by qPCR in Fig. 1). A and C represent a low magnification of the binding sites, whereas B and D represent a higher magnification of the binding sites. It is important to note that the Y-axes represent probabilities of DNA binding (MAT score) and not signal intensities (see the Materials and Methods for details). The scales of the Y-axes are set differently to allow for a spatial comparison of the signals. For example, in A the maximum values of the Y-axes are 5000 for Pol II, 500 for PER, and 80,000 for CLK.

