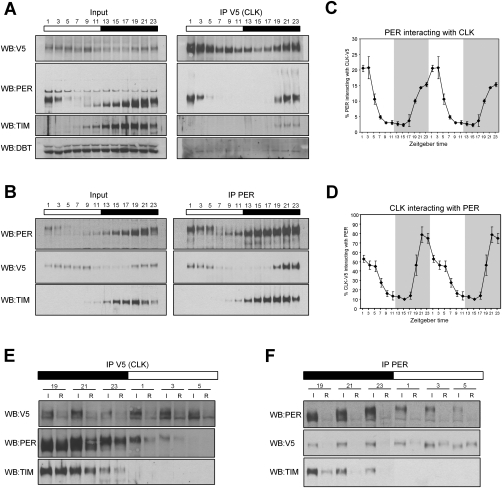
Figure 3.
PER sequesters CLK in a stochiometric complex at the end of the night/beginning of the day. (A,B) IP of CLK-V5 and PER in yw;;dClk-V5 flies. Input samples correspond to ∼15% of the amount of the IP sample. Membranes were analyzed by immunoblotting using antibodies directed against V5, PER, TIM, and DBT. (C,D) Quantification of the PER immunoprecipitated by CLK-V5 (from A) and CLK-V5 immunoprecipitated by PER (from B), respectively. Two independent experiments for each IP were quantified using Image J software (NIH). The ratio of the IP/input signals was calculated and the relative amount of protein immunoprecipitated was plotted as the percentage of PER immunoprecipitated by CLK-V5 (C) or CLK-V5 immunoprecipitated by PER (D). Each time point corresponds to the average ± standard error. (E,F) Effect of CLK-V5 (E) and PER (F) immunodepletion on CLK-V5, PER, and TIM levels. Levels of CLK-V5, PER, and TIM were compared before ([I] input) and after ([R] remaining) the CLK-V5 IP. Similar amounts of total proteins are loaded in every well.

