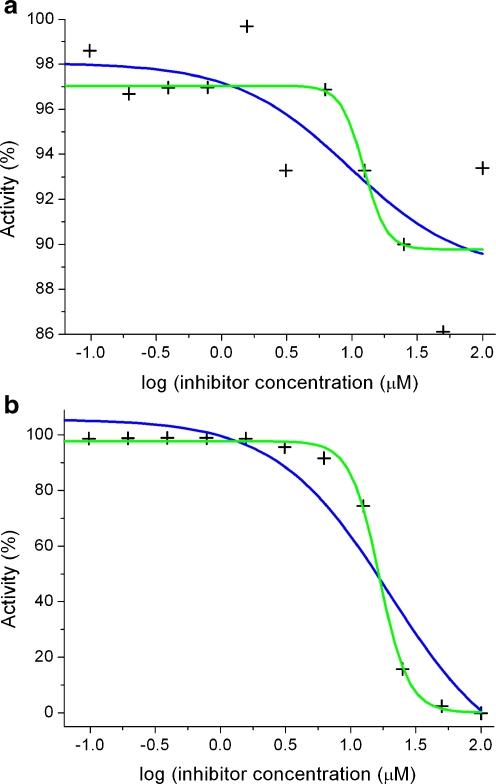
Fig. 1.
High throughput fits for dose–activity curves. The enzymatic activity was related to the activity in the absence of inhibitor (100%). The background was measured from the signal in the absence of enzyme. The data were obtained from a twofold dilution series. Blue line competitive 1:1 inhibition (nH = 1), green line four-parameter logistic fit. a Inhibition of the phosphatase MPTPA by compound 5738, nH = 4.99. b Inhibition of the phosphatase PTP1b by compound 9873, nH = 3.89

