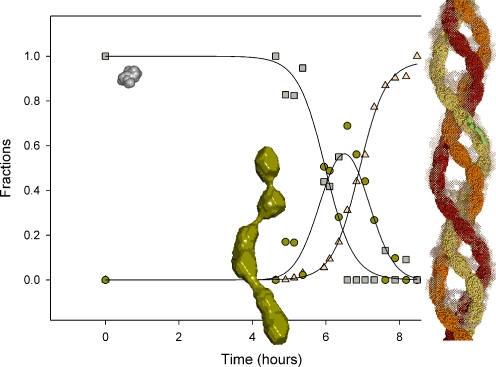
Fig. 8.
Insulin fibrillation process above supercritical concentration shown as the relative volume fractions as a function of time of the three components (monomer (squares), distinct oligomer (circles), and fibril (triangles)) in the fibrillation process of 5 mg/ml insulin in 20% acetic acid with 0.5 M NaCl (pH 2.0) at 45 °C determined using small-angle X-ray scattering (SAXS) [20]. The sizes of monomer and oligomer are on scale, the scaling to the fibril is visualized by the superposition of an oligomer onto the protofibril. The monomer is a surface representation of the isolated monomer from the hexameric structure (1MSO.pdb). The oligomer and fibril structures are ab initio models based on SAXS solution data [20]

