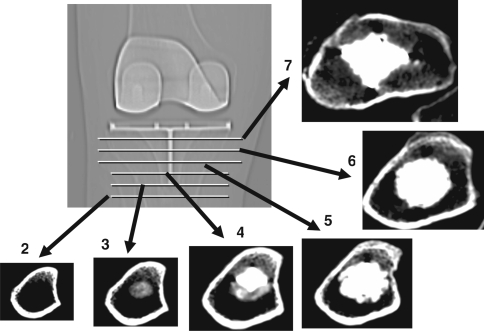
Fig. 1.
A CT scout image shows the levels (horizontal lines) used to establish slices for analysis. The first scan slice was aligned through the tip of the stem with slices taken proximally and distally at 5-mm increments. This image shows representative slices of cortical and cancellous bone along with the implant and cement in the proximal scans. Slices are numbered with 2 the most distal and 7 the most proximal. Slice 1, 5 mm below Slice 2, has been omitted in this diagram.

