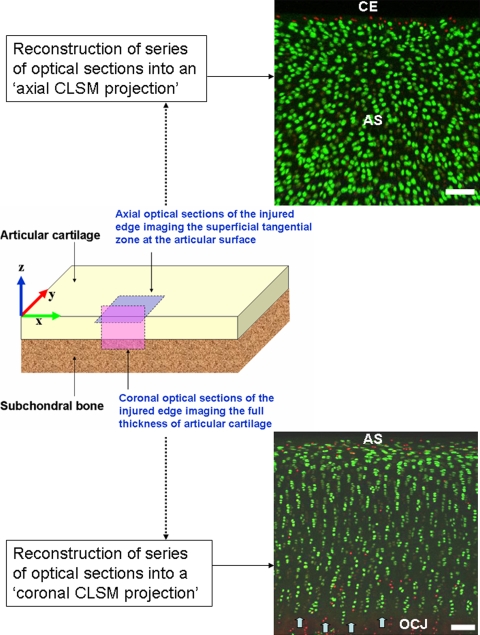
Fig. 2.
CLSM of the coronal and axial planes at the cartilage edge is shown. The x, y, and z axes are labeled on a diagram of a rectangular osteochondral explant. The pink-shaded area on the diagram represents the plane in which coronal optical sections were obtained imaging the full thickness (cut surface) of injured articular cartilage. The reconstructed coronal CLSM projection (bottom image) represents the series of optical sections combined into a single three-dimensional rendition of the imaged volume of cartilage. The articular surface (AS) is oriented toward the top of the image, the osteochondral junction (OCJ) at the bottom of the image, and the tidemark is indicated by the block arrows. The blue-shaded area on the diagram represents the plane in which axial optical sections were obtained, imaging the superficial zone near the cut edge of cartilage. In the corresponding axial CLSM projection (top image), in situ chondrocyte death from the scalpel injury is seen as a band of red-stained nuclei at the cut edge (CE) of cartilage. Farther from the CE, the viable superficial zone chondrocytes in the AS are seen as bright green-stained cells (PI stains the nuclei of dead cells red; CMFDA stains the cytoplasm of live cells green, white bar = 100 μm). CLSM = confocal laser scanning microscopy PI = propidium iodide; CMFDA = 5-chloromethylfluorescein diacetate.

