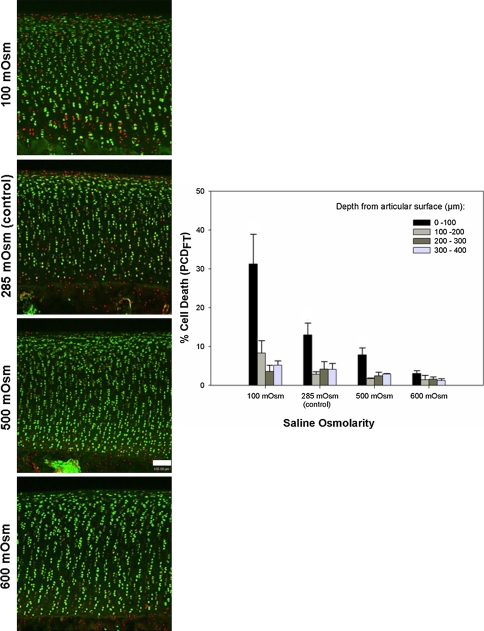
Fig. 3.
Coronal CLSM projections of the injured cartilage edge and PCDFT as a function of increasing saline osmolarity (100–600 mOsm) are shown. The panels show coronal CLSM projections of the full thickness of articular cartilage. The bar chart shows the corresponding pooled data for PCDFT as a function of increasing depth from the articular surface. In situ chondrocyte death is localized mainly near the articular surface (ie, superficial zone, 0- to 100-μm depth interval) for explants exposed to 100, 285 (control), and 500 mOsm saline solutions with relative sparing of the middle and deep zones. At 600 mOsm, there is a decrease in PCDFT in the 0- to 100-μm depth interval of injured articular cartilage. Cell death has been quantified only in hyaline cartilage tissue; the PI staining in the calcified layer of cartilage below the tidemark has not been included. (N = 3, n = 12, white bar = 100 μm). PCD = percentage cell death.

