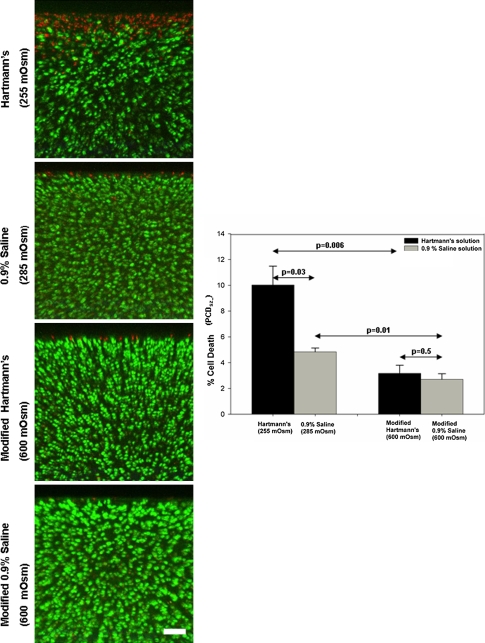
Fig. 6.
Axial CLSM projections of the injured cartilage edge and PCDSZ compare the extent of cell death between 0.9% saline and Hartmann’s solution. The panels show axial CLSM projections of the articular surface. The bar chart shows the corresponding pooled data for PCDSZ as a function of the osmolarity of Hartmann’s solution and 0.9% saline. The band of superficial zone chondrocyte death at the cut cartilage edge decreases after increasing the osmolarity of Hartmann’s solution (255 mOsm) and 0.9% saline (285 mOsm) to 600 mOsm (N = 3, n = 36, white bar = 100 μm). CLSM = confocal laser scanning microscopy; PCD = percentage cell death.

