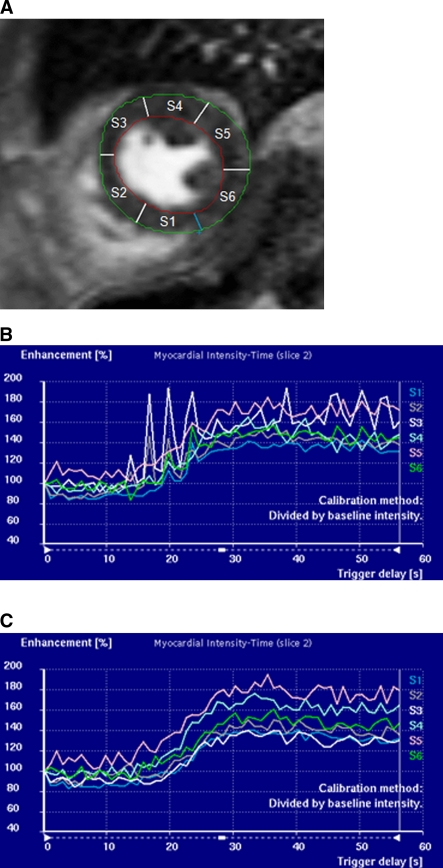
Fig. 2.
Short-axis image at a mid ventricular slice level with endo- and epi-cardial contours defined and the myocardium divided into 6 segments (a). Signal-intensity versus time curves are derived for each of the myocardial segments. Without motion correction (b) the curves are not suitable for quantitative analysis. After motion correction (c), perfusion indices such as maximum upslope can be derived reliably

