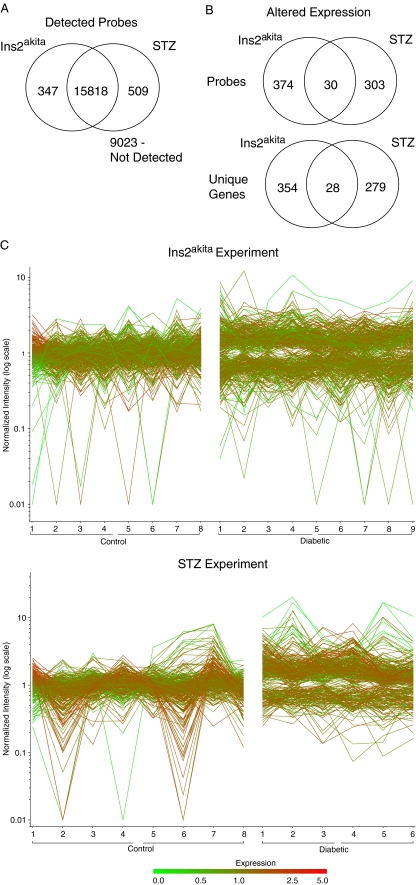
Fig. 1.
Microarray analysis of retinal gene expression after 3 months of hyperglycemia. a 95% of the probes with detectable signal in the microarray analysis were shared between the two mouse models of type 1 diabetes. b Set analysis of the sets of differentially expressed (p < 0.05, ≥1.4-fold) probes and genes in the two models reveals changes common to both models. The majority of expression changes were specific to one model or the other. c Probes with statistically significant differences in signal (p < 0.05) and ≥1.4-fold change are plotted for each animal in the analysis. The normalized (to a mean control level of 1) intensity is plotted on the y-axis with each individual animal analyzed on the x-axis for both experiments. Each horizontal line is an individual probe. This presentation provides an overview of the interanimal variance as well as differences between the groups

