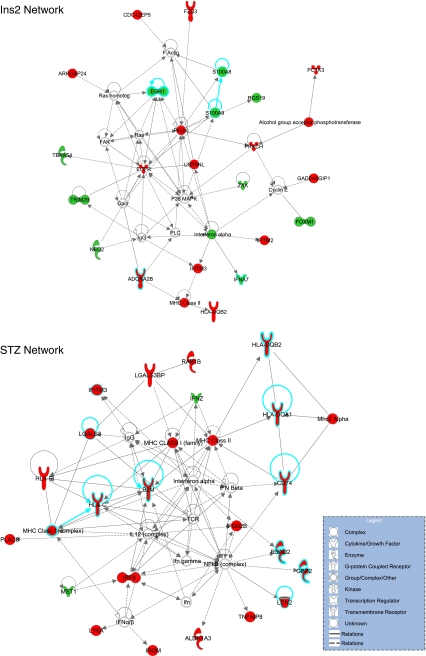
Fig. 2.
Network analysis of microarray data for each of the experiments. Network analysis (ingenuity) identifies sets of genes with known relationships that are unlikely (p < 0.05) to occur by random chance. The most significant network for each experiment is shown. In the Ins2Akita experiment, a network with a number of genes related to inflammation (blue borders) was identified, while the STZ experiment network contained a number of genes (blue borders) that have been previously reported to be altered in mRNA or protein expression in animal models or clinical specimens. Red indicates upregulation, and green indicates downregulation of transcript levels. Uncolored genes were not observed to be differentially expressed in the microarray analysis but are integral parts of the network

