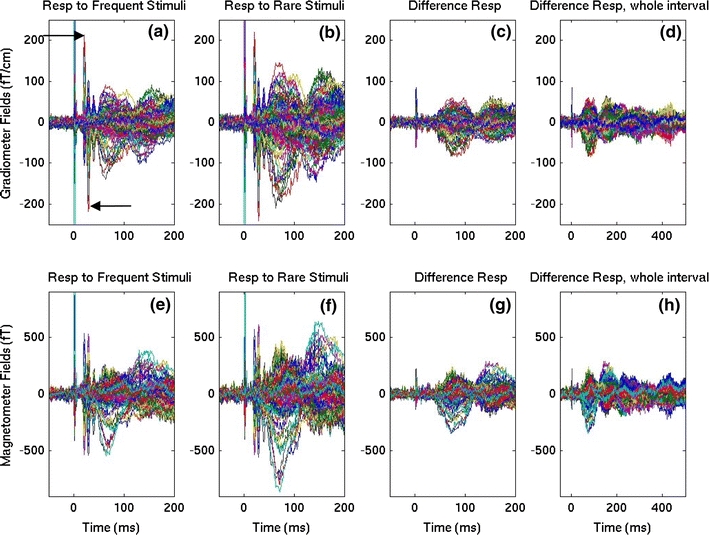
Fig. 2.

MEG sensor waveforms from 204 gradiometer channels (102 pairs of co-located orthogonal pairs; top row) and 102 magnetometer channels (bottom row) in a representative healthy control participant evoked by right median-nerve oddball stimuli averaged over “frequent” and “rare” trials. a Gradiometer waveforms for the first 200 ms interval evoked by frequent stimuli. The two arrows indicate the sharp N20m and P30m components. b Gradiometer waveforms for rare stimuli. Note the marked increase in averaged signal amplitude. c Gradiometer waveforms of rare minus frequent oddball responses. d Same as c, but for the whole 500 ms interval. The bottom row displays magnetometer waveforms for the frequent (e), rare (f), rare minus frequent responses for the first 200 ms (g), and for the whole 500 ms interval (h), respectively
