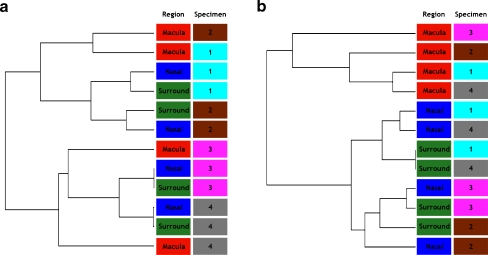
Fig. 3.
Hierarchical clustering of the microarray gene expression profiles. The sample region (left column) and specimen (right column) is indicated for each array in the dendrograms. a. Hierarchical clustering before application of the batch effect filter. Clustering is greatest between arrays within specimens and batch. The four most similar pairs of arrays (shortest dendrogram branches) are the nasal and surround arrays from each specimen. The greatest dissimilarity in the dendrogram exists between the two batches (specimens 1 and 2 versus specimens 3 and 4) since the final (leftmost) cluster exists between these two groups of arrays. b Hierarchical clustering after application of the batch effect filter. The macula arrays exhibit greater similarity with each other than with the nasal or surround arrays, even from the same specimen

