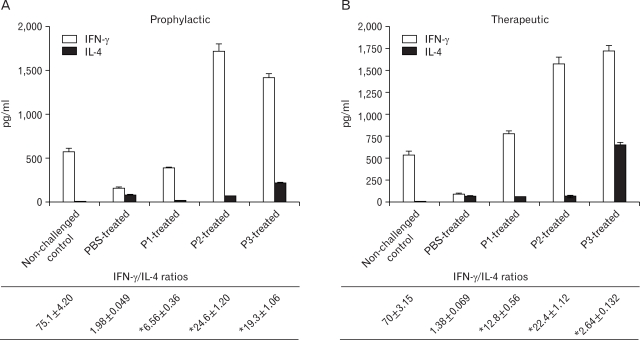
Figure 4.
Levels of IFN-γ and IL-4 cytokines in splenic supernatants of PBS/peptide-treated mice groups (P1-P3) in prophylactic (A) and therapeutic regimen (B) quantitated by sandwich ELISA and their respective IFN-γ/IL-4 ratios shown below the graph. Each regimen had 5 groups of mice: Non-challenged control, PBS-treated Afu-challenged (prophylactic) or ABPA (therapeutic), P1-treated, P2-treated and P3-treated mice. Data represents the mean±SD of triplicate determinations with five mice per group, *p<0.05 versus PBS-treated Afu challenged (prophylactic) or ABPA mice (therapeutic).

