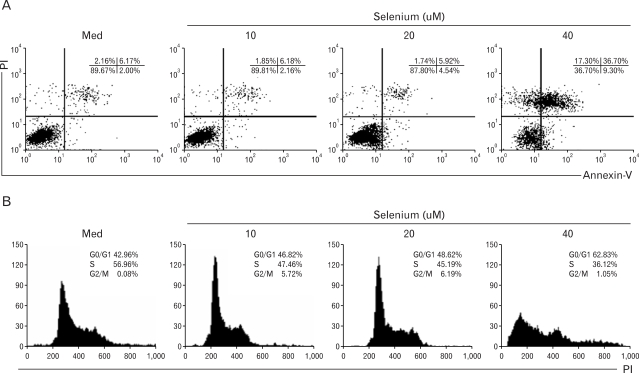
Figure 2.
Selenium-induced cell death and cell cycle arrest of B16F10 murine melanoma cells. (A) B16F10 melanoma cells (2×10⁵) were seeded onto a 6-well plate overnight to undergo attachment. Cells were exposed to selenium (0, 10, 20, and 40 uM) and then incubated for 48 hr. After incubation, cells were harvested with cell dissociation solution and washed once with PBS. The cytotoxic effect of selenium on B16F10 melanoma cells was assessed by Annexin-V-FITC/PI staining. Cell death analysis was performed by flow cytometry. The numbers indicate the percentages of the viable (Annexin-V -; PI -) cell population (lower left quadrant), the apoptotic (Annexin V+) cell population (lower right quadrant), and the necrotic cell populations in the upper right (Annexin-V +; PI +) and the upper left quadrants (Annexin-V -; PI +). (B) B16F10 melanoma cells were treated with selenium (0, 10, 20, and 40 uM) and then incubated for 48 hr. Cells were harvested with cell dissociation solution, washed twice with cold PBS, and centrifuged. The pellet was resuspended in 1 ml of cold PBS and 4 ml of cold ethanol for 30 min at 4℃. Cells were then stained with propidium iodide 30 min and analyzed by flow cytometry. Percentages of G0/G1-, S-, and G2/M-phase cells are shown in this figure.

