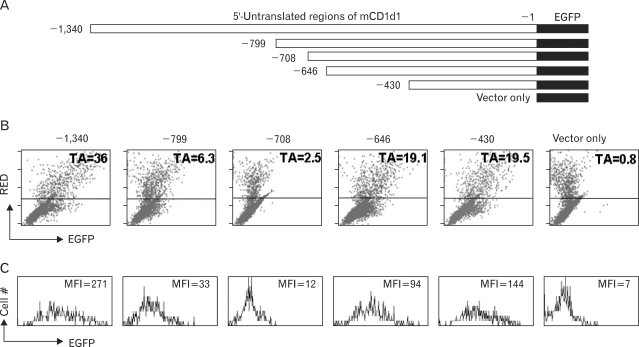
Figure 2.
Expression of EGFP in DsRed-positive cells. (A) Promoter regions of mouse CD1d1 were cloned into the MCS of pRedEGFP and transfected into the Bcl-1 lymphoma cell line. Cells were harvested 72 hours after transfection. (B, C) In flow cytometric analyses, transfected cells, which evidence constitutive DsRed expression (above the horizontal line of each panel), were gated (B), and their EGFP expression is presented in histograms (C). EGFP expression was readily detectable among the DsRed-positive population, although the transfection efficiency was rather low (~5%, the ratio of DsRed-positive cells). The TA (transcription activity) of the DsRed-positive cells was calculated as follows: (MFI of EGFP/MFI of DsRed)×100%. The X and Y-axes of the dot-plot and the X-axis of the histogram-plot were represented on a log scale, from 100 to 104. The Y-axis of histogram-plot is shown as a linear scale.

