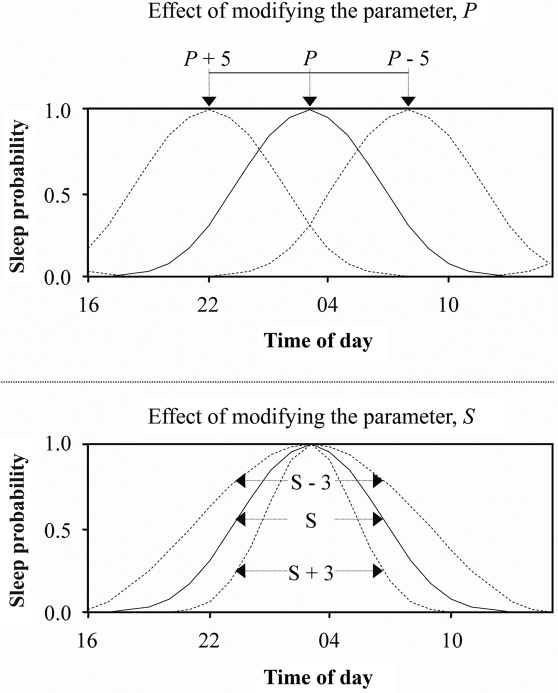
Figure 2.
Effect of modifying the P (top panel) and S (lower panel) parameters of the baseline regression equation (Equation #1). Continuous lines represent distributions for any given value of P and S, respectively. Broken lines represent the curve translations that result from adding or subtracting from the given values.

