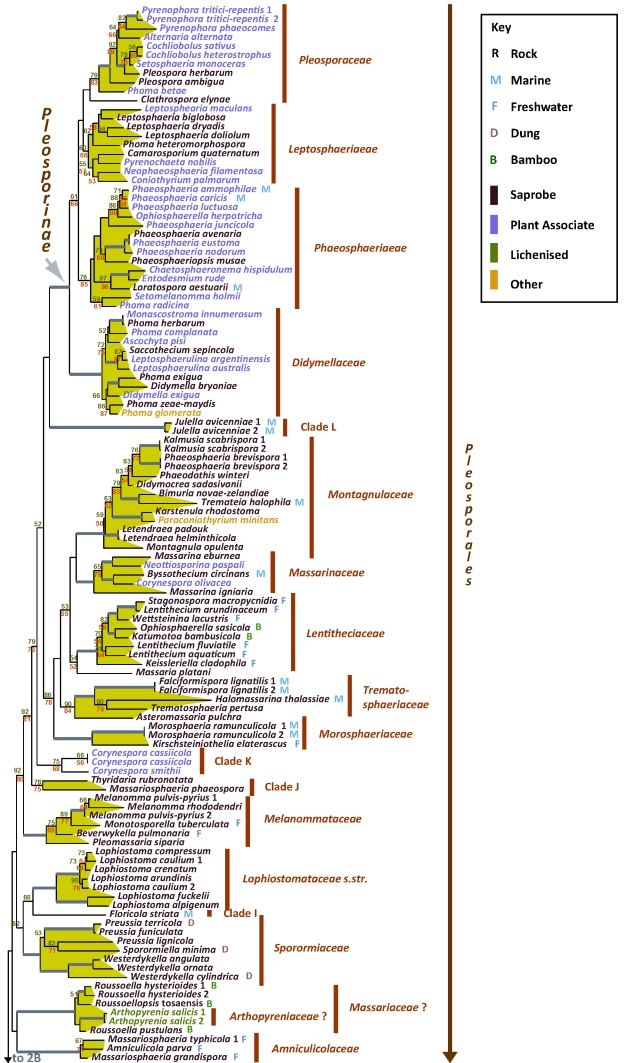
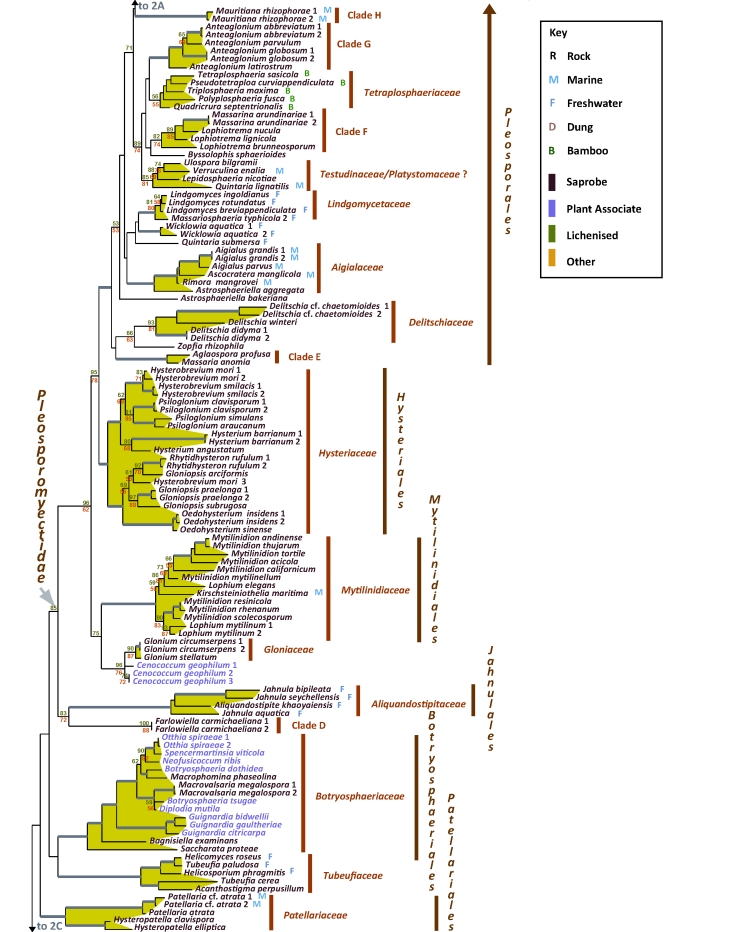
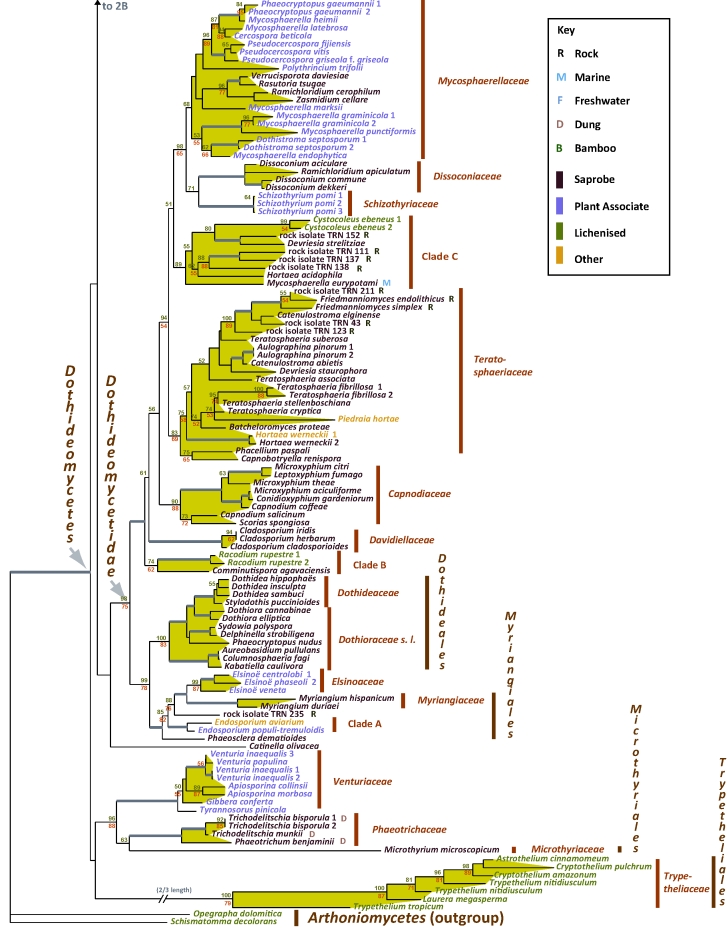
Fig. 2A–C.
Best scoring ML tree with RAxML and GARLI bootstrap values respectively above (green) and below (red) the nodes. Values below 50 % were removed and branches with more than 90 % bootstrap for both methods are thickened without values. Environmental sources relevant to the papers in this volume are indicated in the key (R-Rock; M-Marine; F-Freshwater; D-Dung; B-Bamboo). Nutritional characters are indicated by colour as per the key.


