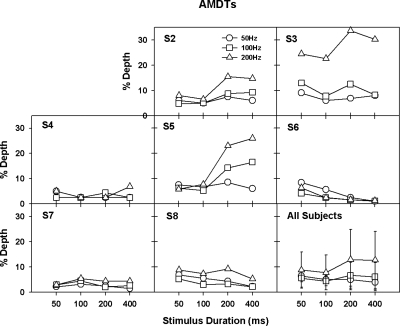
Figure 1.
AMDTs (in percent) as a function of stimulus duration. The results from individual subjects are shown in different panels. The right-bottom panel shows group mean data. The open circles, open squares, and open triangles represent the data for 50-, 100-, and 200-Hz AM frequencies, respectively.

