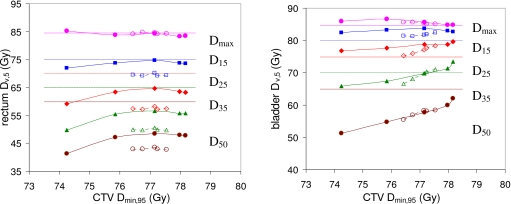
Figure 4.
Patient 10 rectum and bladder doses Dmax,5 (●), D15,5 (◼), D25,5 (◆), D35,5 (▲), and D50,5 (●) plotted against CTV Dmin,95. Line and symbol conventions are as in Fig. 3. For this patient, bladder doses are actively limiting the CTV Dmin,95, rectum doses are not.

