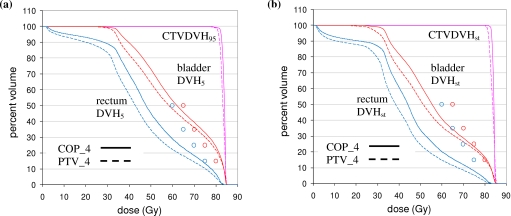
Figure 6.
(a) Percentile DVHs for the same patient (patient 10) as in Fig. 4 for COP_4 (solid) and PTV_4 (dashed) plans. The CTV DVH is the 95% DVH (DVH95), while the rectum and bladder DVHs are 5% DVHs (DVH5). (b) Static DVHs for patient 10. In both plots, static OAR optimization criteria are indicated by circles (see Table 1).

