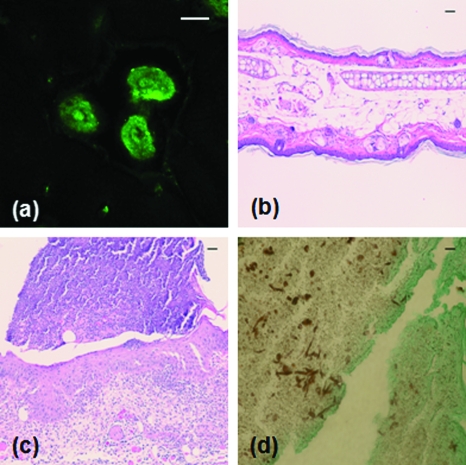
Figure 3.
Microabscess formation in infected ear tissue. 72 h after injection, mouse ears were imaged for fluorescence signal as in Figs. 12, after which the mouse was then euthanized and the ears were harvested, fixed in 10% formalin, and sectioned and stained for histological analysis. (a) Representative in vivo fluorescence image illustrating the formation of microabscess. The scale bar represents 100 μm. Hematoxylin-and-eosin stained sections of (b) the saline injected control ear and (c) the C. albicans injected ear. (d) Sections were stained with Modified Grocott’s Methenamine Silver stain (Richard Allan Scientific staining kit, VWR, West Chester, Pennsylvania) to demonstrate the presence of C. albicans in the tissue. Bright field images shown in (b), (c), and (d) were acquired with a 40×, 0.95-NA objective and the scale bars represent 10 μm.

