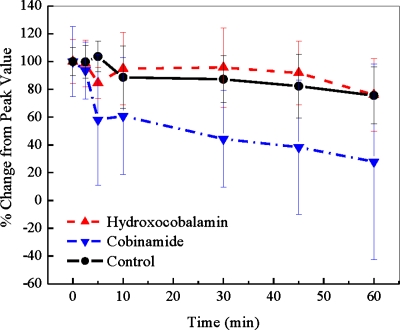
Figure 4.
RBC cyanide concentrations. The concentration of cyanide in RBCs is shown at the end of the cyanide infusion (zero time) and for 60 min thereafter. At zero time, the animals received saline (controls), hydroxocobalamin, or cobinamide. Values are expressed as percent of the peak cyanide levels achieved at the completion of cyanide infusion and shown as mean and standardized error. Cobinamide-treated animals had significantly faster reduction in blood cyanide levels compared to hydroxocobalamin and control groups.

