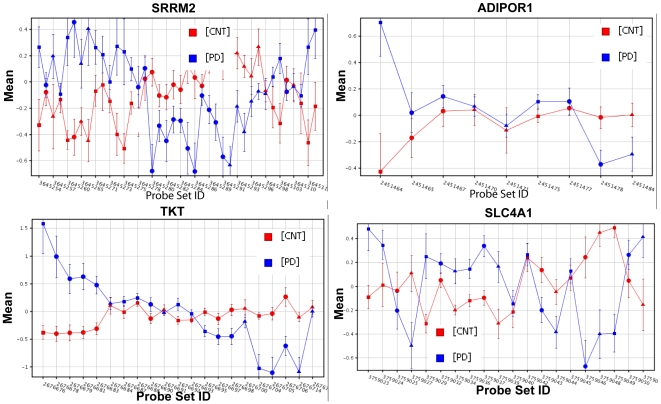
Figure 3. Differential Exonic expression in PD Blood.
Splicing Analysis reveals significant differential exonic expression within 218 genes (p<0.05 with Benjamini Hochberg FDR correction). Shown here are SRRM2, ADIPOR1, TKT, and SLC4A1, all four genes were also differentially expressed in the Scherzer blood data (p<0.05 with no multiple correction). Each probeset represents an exon. Note that in SRRM2, the 5′ exons are upregulated while the downstream exons are downregulated in PD patients versus controls.

