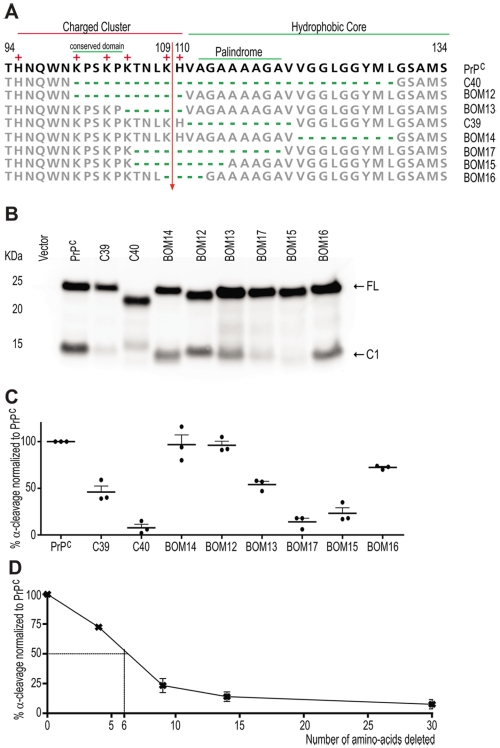
Figure 4. Search for a defined domain within PrPC that regulates its α-cleavage.
A: Amino acid sequence alignment of the PrPC constructs used. Numbers represent amino acid residues. The positive residues, the charge cluster, hydrophobic core, palindrome and the conserved 100–104 domain are highlighted. Arrow: α-cleavage site. B: Western blot of PNGase treated cell lysates of Hpl cells transfected with the PrPC deletion constructs used in the current study. Detection was done with POM1. Arrows point to the full length PrP (FL) and C1 fragment. C: Quantification of the percentage of α-cleavage of the various PrPC mutants, based on densitometry of western blots, from which (B) is representative. Quantifications were calculated in the linear range of the densitometric signal of independent experiments. Values refer to the amount of C1 generation comparing to total abundance of PrPC, and are normalized to cleavage of PrPC, which was assessed in the same blot. Error bars represent the SEM. D: Graphic illustrating the percentage of α-cleavage impairment of PrPC deletion mutants. Points correspond to the average value illustrated in (C), for the samples PrPC, BOM16, BOM15, BOM17 and C40, which have 0, 4, 9, 14 and 30 amino acids deleted, respectively. In x-axis are plotted the size of the deletion of each of these constructs. Dashed line refers to the estimated deletion size that would result in 50% inhibition of α-cleavage.

