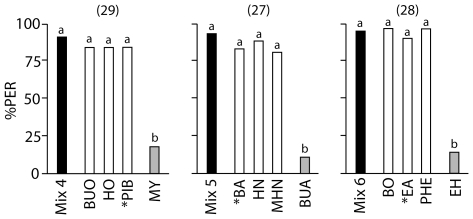
Figure 3. Effect of Odorant Uniqueness on Key Odorant Signatures.
The ordinate represents the percentage of proboscis extensions (PER) to the training mixture (black bars), to the individual test odorants that the mixture was composed of (white bars), and to a control odorant that was not part of the training mixture (grey bars). Each mixture was composed of two odorants with the same functional group and one unique odorant with a different functional group, indicated by *. The control odorant shared the chemical characteristic of the unique odorant. The numbers in brackets indicate the numbers of bees trained and tested in each experiment. Different letters above bars (a or b) indicate significant differences between PER to the training mixture and to the individual odorants (McNemar test [2×2 Table], Bonferroni corrected threshold p<0.0125). Bees responded to the individual odorants of a mixture as well as to the training mixture, but responded significantly less to the control odorant. (Left) Bees were trained to mixture 4; (Centre) bees were trained to mixture 5; (Right) bees were trained to mixture 6. For mixture compositions see Table 6. Odorants are listed alphabetically by their abbreviations; for corresponding odorant names, see Table 1.

