Figure 4.
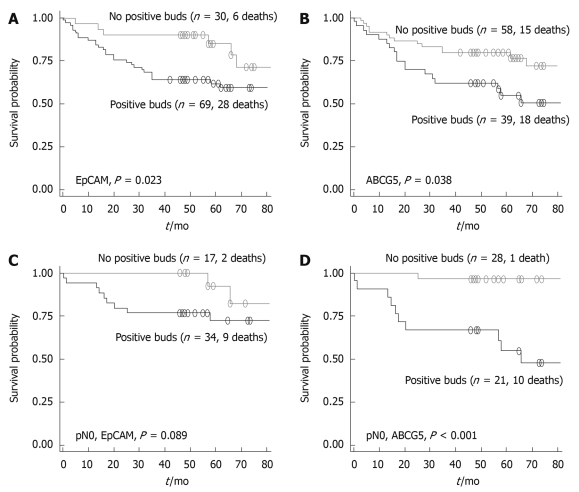
Kaplan-Meier survival curves illustrating the prognostic differences in patients with or without positive staining of EpCAM (A) and positive staining of ABCG5 (B) in tumor buds; differences in prognosis are further analyzed for lymph node-negative patients differing in EpCAM (C) and ABCG5 (D) expression in tumor buds.

