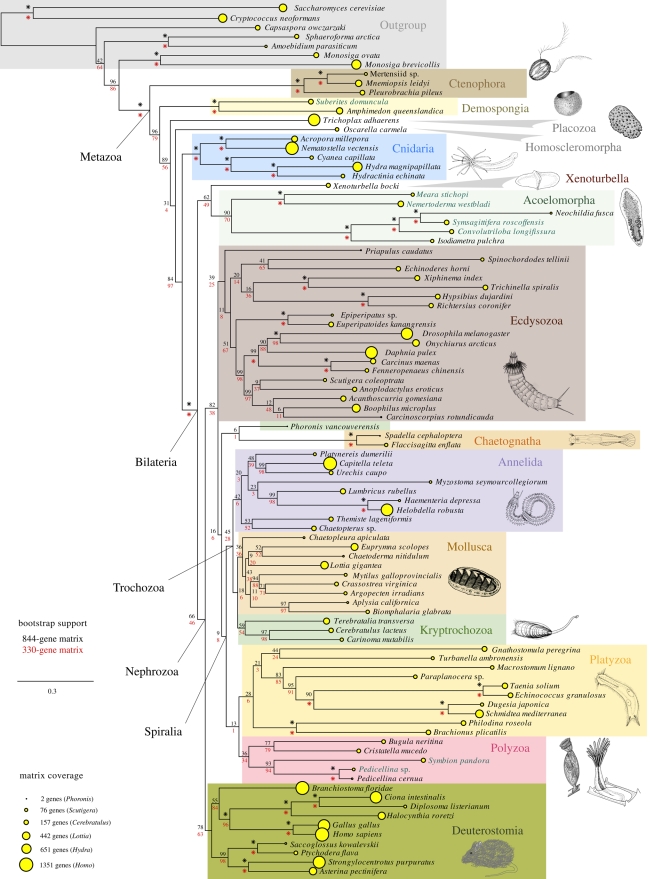
Figure 2.
Phylogram of the most likely tree found in ML searches of the 1487-gene matrix (37 searches, log likelihood = −6 124 157.6). The area of the yellow circle at each tip is proportional to the number of genes present in the 1487-gene matrix for the indicated species (see table S2 in the electronic supplementary material for values). Bootstrap support from analyses of the 844-gene (black values above nodes, 201 bootstrap replicates) and 330-gene (red values below nodes, 210 bootstrap replicates) subsamples of the 1487-gene matrix are also shown at each node. Asterisk indicates 100 per cent bootstrap support. Species for which new EST data are produced are highlighted with green species names.

