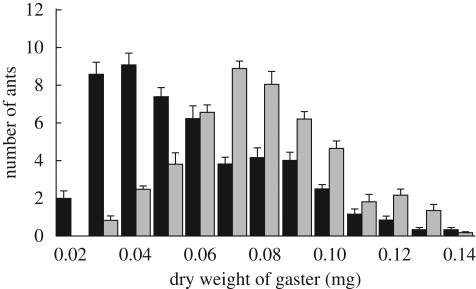
Figure 2.
Corpulence distribution, measured as gaster dry weight of worker ants in the two age cohorts, mean + s.e., n = 6 colonies. Callow gaster dry weight (grey bar) (mean ± s.d. = 0.078 ± 0.023 mg) is higher than mature gaster dry weight (black bar; 0.0583 ± 0.0260 mg; two-way ANOVA: F1,5 = 99.9, p < 0.001). There was also significant inter-colony variation (F1,5 = 5.7, p < 0.001).

