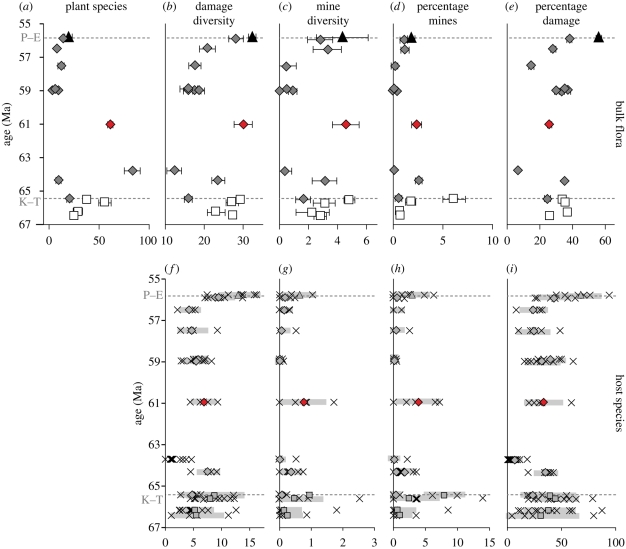
Figure 2.
Insect damage on (a–e) bulk floral assemblages and (f–i) individual plant hosts from Menat compared with US Western Interior floras. (a) Number of dicot species at each site rarefied to 400 leaves; error bars represent the standard error of Heck et al. (1975). (b) Total damage diversity (number of DTs) on each flora standardized to 400 leaves by averaging damage diversity for 5000 random subsamples of 400 leaves without replacement. Error bars represent ±1σ of the mean of the resamples. (c) Sampling-standardized mine diversity on the bulk floras, calculated as in (b). (d) Percentage of leaves at each site with mines. Error bars represent ±1σ, based on a binomial sampling distribution. (e) Percentage of leaves with damage at each site with damage; error bars as in (d). (f) Damage diversity on individual species at each site, standardized to 25 leaves. Each × represents a single plant host, which was randomly resampled without replacement as in (b). The filled symbols are the among-species means for the site, and the thick grey lines delineate one standard deviation. (g) Sampling standardized mine diversity on individual host plants, as in (f). (h) Percentage of leaves of each species (with at least 25 leaves in the flora) with mines. Symbols as in (f). (i) Percentage of leaves of each species with damage, as in (h). P–E, Palaeocene–Eocene boundary; K–T, Cretaceous–Palaeogene boundary. (a–e) Bulk flora: black triangle, Eocene; grey diamond, Palaeocene; red diamond, Menat; white square: Cretaceous. (f–i) Host species: triangle, diamonds and square, site average; cross, single host.

