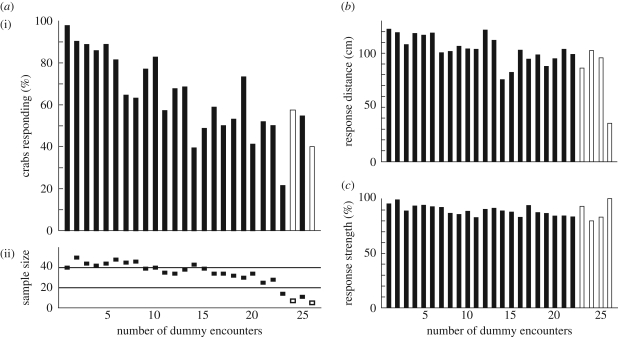
Figure 2.
Crabs are less likely to respond to a moving dummy predator after repeated encounters. The x-axis in each panel shows the number of times a particular crab had actually encountered the local dummy move. For a crab that was underground during the first dummy movement, the second movement would be its first encounter. Open bars and boxes indicate runs where less than 10 crabs contributed. (a) (i) Percentage of crabs that ran home as the dummy approached (p < 0.001). (ii) Sample sizes. (b) Response distance, measured as the distance between dummy and crab at the time of response. Distances are only available for runs where crabs responded (p < 0.001). (c) Response strength, measured as the percentage of distance towards the burrow the crab ran home (p < 0.001).

