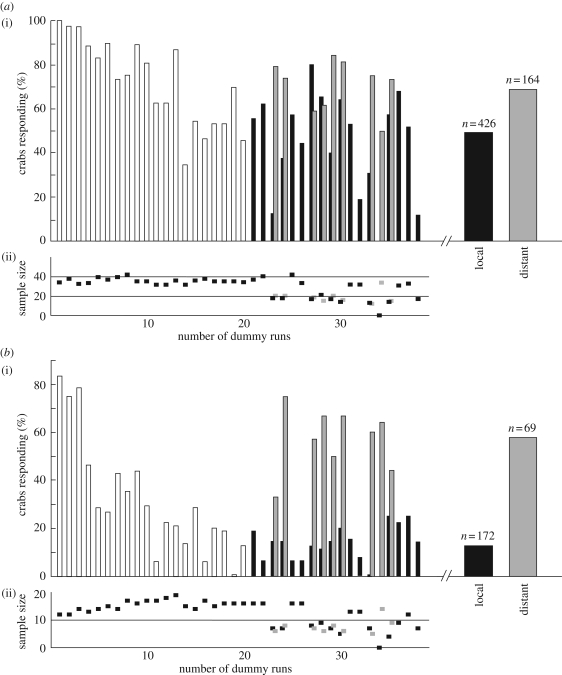
Figure 5.
After an initial habituation phase to the local dummy, the crabs were more likely to respond to a dummy approaching from a distance. (a(i)) Probability of crabs running home (p < 0.001). (b(i)) Probability of crabs going underground (p < 0.001). In both panels, response probability is plotted against actual dummy runs rather than encounters as in figures 2 and 4. This was necessary to pool the data from the distant dummy movements in order to calculate meaningful percentages. Open bars, habituation phase to the continuously visible local dummy; black bars, response probability to local dummies after the habituation phase; grey bars, response probability to distant dummies. The only difference between the two dummy types was their approach distance. The distant dummy moved along the same track but started 4 m further away. Wide bars on the right show the mean response probability for the local dummy (black bar) for runs 21–38 and the distant dummy (grey bar). a(ii) and b(ii) Sample sizes for each dummy approach.

