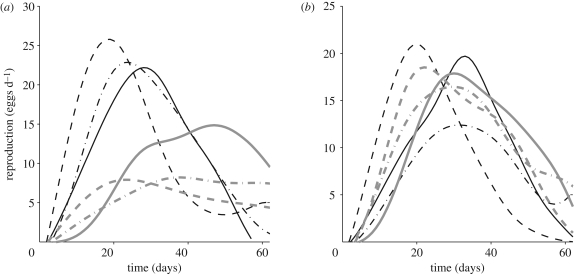
Figure 1.
Estimated mean reproductive functions for (a) the selected survival-unadjusted and (b) survival-adjusted samples. In both (a,b), the thinner black lines represent the short-lived cohorts (solid line, Guatemala; dashed line, Kenya; dash-dot line, Hawaii) and the thicker grey lines represent the longer lived cohorts (solid line, Greece; dashed line, Portugal; dash-dot line, Brazil).

