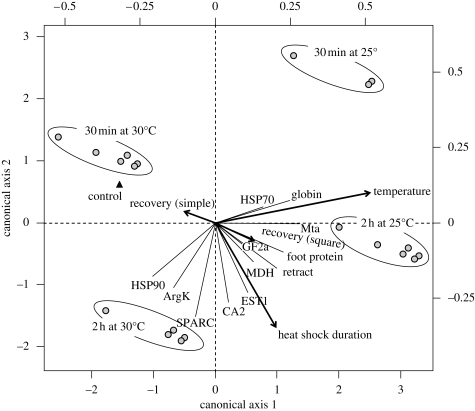
Figure 3.
Ordination biplot representing the significant (p < 0.05) effect of experimental (temperature, heat-shock duration and recovery) factors (arrows) on mRNA expression of 12 genes in mussels exposed to thermal challenge (25 and 30°C during 30 and 120 min) at atmospheric pressure. Lines represent the response variables.

