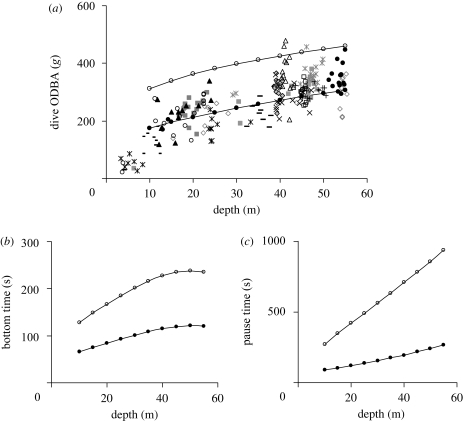
Figure 6.
(a) The dive ODBA values that would maximize the efficiency (line with open circles) and the rate of gain (line with filled circles) are given in relation to dive depth, along with the data from the individual birds (given as separate series). The duration of the (b) bottom phase and (c) surface pause are given for efficiency- and rate-optimizing model predictions.

