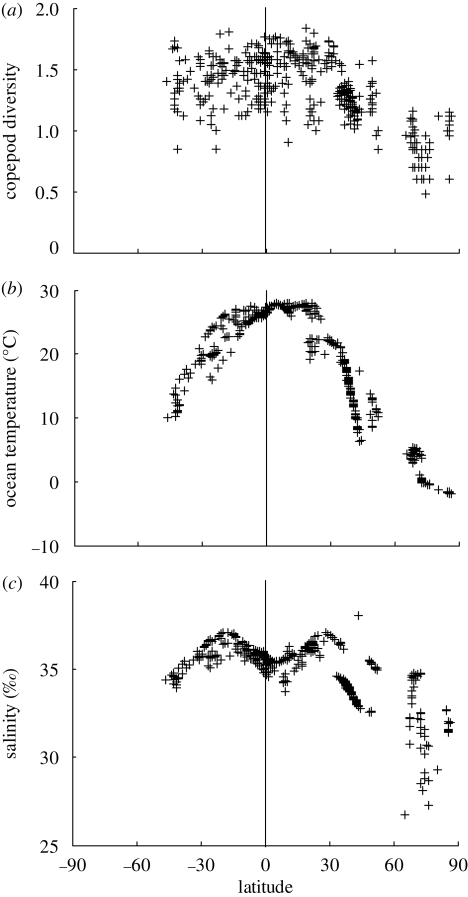
Figure 2.
(a) Mean copepod diversity as a function of latitude (by convention latitudes S are shown negative). Each point (433 grid cells) represents the log-transformed number of species (log) present in each square on a 1° × 1° degree geographical grid. The vertical line corresponds to the Equator. There is a hump-shaped distribution of diversity in the Northern Hemisphere with a peak around 20° latitude followed by a sharp decrease north of 40° latitude. (b) Ocean temperature as a function of latitude. Each point indicates mean temperature (data source in table S1 in the electronic supplementary material) per grid cell corresponding to the grid cells with copepod diversity data. The shape of the distribution of temperature over latitudes is similar to that of copepod diversity in the upper panel, in particular the peak at 20° N followed by a sharp decline to 40° N. (c) Salinity as a function of latitude. Each point indicates mean salinity (data source in table S1 in the electronic supplementary material) per grid cell corresponding to the grid cells with copepod diversity data. The shape of the latitudinal change is not symmetrical on the two sides of the Equator. The Inter Tropical Convergence Zone (ITCZ) in the Northern Hemisphere reduces salinity between the Equator and 20° N and coincides with an area of relatively lower diversity.

