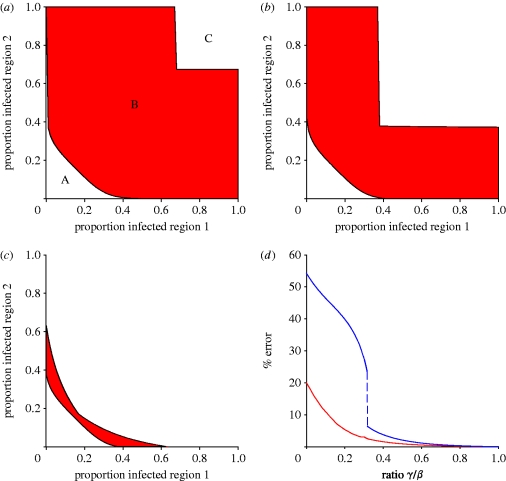
Figure 2.
Transmission between regions and the error between the best and worst policies. (a–c) Effect of the between-region transmission rate γ (scaled by β) on the magnitude of the instability zone B (shown in red) in which the best and worst paths lead to marked differences in epidemic behaviour with one controlling the epidemic and the other leading to ‘explosive’ infection towards high levels of infection (figure 1; instability zones for (a) γ/β=0, (b) γ/β=0.008 and (c) γ/β=0.02). (d) Effect of changing the ratio of γ/β on the maximum (blue line) and average (red line) errors between the best and worst policies.

