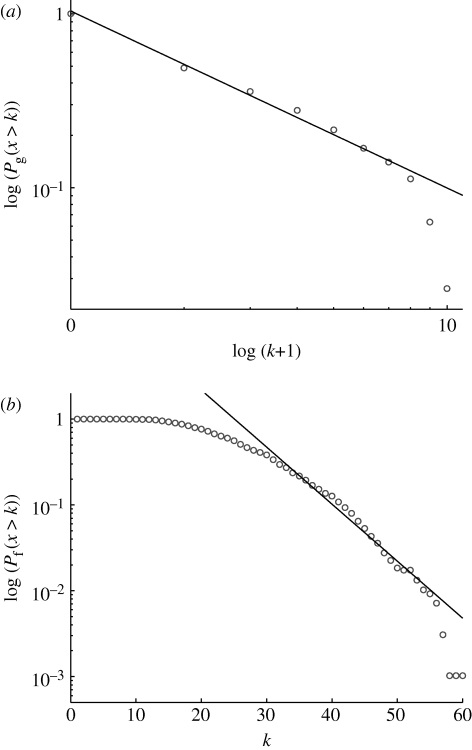
Figure 5.
The gene (instruction) and function cumulative degree distributions calculated from the digital organisms. (a) The gene degree distribution exhibits a scale-free decay with a cut-off for large k and (b) the function degree distribution that decays exponentially for k larger than the mean degree 〈 k 〉≈26. Note that the gene distribution in (a) is shifted in order to allow for the inclusion of instructions with 0 degrees.

