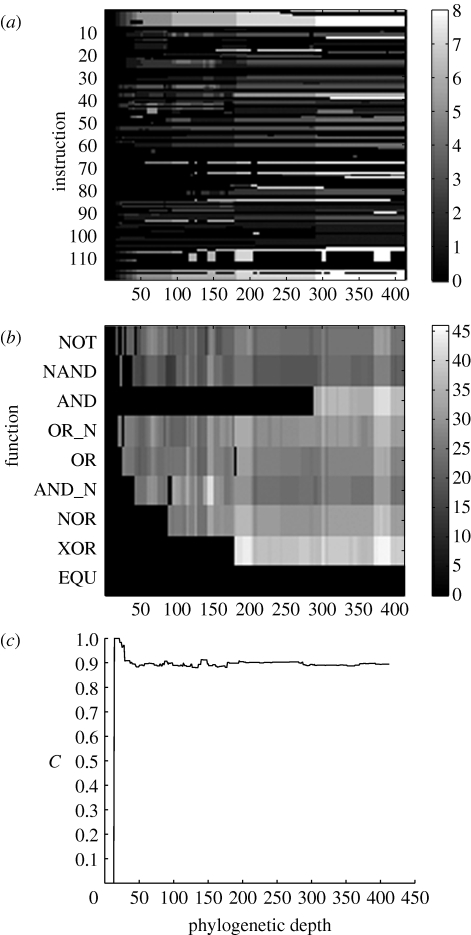
Figure 6.
The evolution of the gene–function relationship for one lineage of digital organisms. (a) The FGA is summed along the function dimension showing how many functions each instruction (or gene) is involved in as a function of the phylogenetic depth in the lineage. (b) The FGA has been summed along the instruction dimension instead, showing how many instructions each function depends on. (c) The average clustering coefficient increases sharply when the first functions are acquired, but then remains essentially constant with only small fluctuations around the average.

